|
|
 | Popular Guides | |
 | Related Guides | |
|
|
|
|
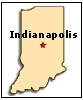
State Profile >> Indiana
|  Back Back |
|
|
| 35,853 Views |
NickName: The Hoosier State
"Land of the Indians"
Capital City: Indianapolis
Location: 39.776N, 086.146W |
|
|
|
 |
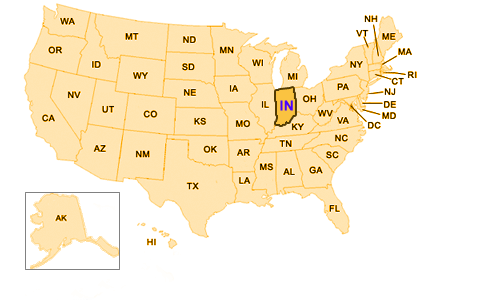
| View USA Map |
|
| Brief overview |
|
|
Indiana has a cost of living almost three fourth's of national average. This makes the state attractive for “economy seeking” households. Not just that, Indiana leads in the industrial and agri-products as well. (Much of the building limestone used in the U.S. is quarried in Indiana)
IN is a small state, and the only large city is Indianapolis, that contrasts with the remaining portion of the state which is largely rural. You can make your kids happy if you promise them to take to the world's largest children's museum(of course its there in IndianaPolis). If you are an avid walker, skater or a cyclist you have a recreational path - The Monon Trail.
Other attractions include the recently legalized riverboat casinos, Wyandotte Cave, one of largest in the US, mineral springs, Indiana Dunes National Lakeshore, Indianapolis Motor Speedway, Lincoln Boyhood National Memorial, and the George Rogers Clark National Historical Park.
Artists such as J.C. Steele, a member of a group of impressionists known as the Hoosiers, established colonies in this impressive area that provided inspiration for their paintings. |
|
| 15 Vital Statistics Affecting Your Relocation |
IN |
|
USA |
|
|
| 1. |
Belief: "Most People are Honest" (6-level agree/disagree) |
3.83 |
4 |
|
| 2. |
Belief: "Most People Can be Trusted" |
0.43 |
0 |
|
| 3. |
Attended Meetings in Town or School Affairs (percent) |
0.17 |
0 |
|
| 4. |
Overall State Ranking - New Economy Index |
36th |
|
|
| 5. |
Cost of Living Index |
73.08 |
100 |
|
| 6. |
Average Apartment Rent |
572.0000 |
617 |
|
| 7. |
Average Home Price |
210000.0000 |
223400 |
|
| 8. |
Average Total Energy Cost |
122.6900 |
126.75 |
|
| 9. |
Average Phone Bill |
22.7200 |
16.85 |
|
| 10. |
Gasoline/Gallon |
1.5000 |
1.5 |
|
| 11. |
Hospital Room/Day |
614.0000 |
334.33 |
|
| 12. |
Doctor Visit |
58.7500 |
66.7 |
|
| 13. |
Average Auto Insurance Premium, 2000 |
698.18 |
792.91 |
|
| 14. |
% of Days That are Sunny |
51 |
56.88 |
|
| 15. |
Crime Index |
371.8 |
416 |
|
|
| Contents |
|
| Indiana Info for you |
(All Links open in a separate window) 
|
|
| Area |
36420 sq.mi, 38th Land 35870 sq. mi., 38th Water 550 sq.mi., 39th Great Lakes 235 sq.mi., 8th |
|
| Area Code |
219, 260, 317, 574,765, 812 |
|
| County Profile |
92 Counties |
|
| Motto |
The crossroads of America |
|
| Capital |
Indianapolis |
|
| Largest Cities |
Indianapolis
Fort Wayne
Evansville
South Bend
Gary
Bloomington
Muncie
Anderson
Terre Haute
|
|
| Capitol Tour |
www.in.gov/idoa/2371.htm |
|
| State Official Website |
http://www.in.gov/ |
|
| Governor |
Mike Pence (R) |
|
| No. of State Legislators, 2003 |
150 |
|
| Senators and Representatives |
US House
US Senate
Indiana House: Members
Indiana Senate: Members
|
|
| Industry |
Steel, electric equipment, transportation equipment, chemical products, petroleum and coal products, machinery. |
|
| Agriculture |
Corn, soybeans, hogs, cattle, dairy products, eggs. |
|
| Tree |
Yellow-poplar |
|
| Geographic Center |
Boone, 14 miles northnorthwest of Indianapolis |
|
| Highest Point |
Hoosier Hill |
|
| Lowest Point |
Southwest boundry; 320 feet, 35th |
|
Fatalities Caused by Tornadoes:
1950 to 2001 |
222 |
|
|
| Average Temperatures |
IN |
|
USA |
|
|
| Winter |
38.85 |
42.79 |
|
| Spring |
62.34 |
64.36 |
|
| Summer |
83.47 |
83.95 |
|
| Fall |
64.79 |
65.89 |
|
| Precipitation(Rain Fall) |
43.31 |
39.41 |
|
| % of Days That are Sunny |
90.98 |
103.29 |
|
|
| More Indiana |
| Titbits |
|
|
| Nickname including its origin |
The Hoosier State ,"Land of the Indians" |
|
| Symbols |
flower: peony (1957)
tree: tulip tree (1931)
bird: cardinal (1933)
song: “On the Banks of the Wabash, Far Away” (1913)
river: Wabash
stone: limestone
|
|
| Song |
On the banks of the Wabash Click Here for Song Click Here for Song |
|
|
| Demographics |
IN |
|
USA |
|
|
| Median Age 2000 |
35.96 |
37.8 |
|
| % Change in Population 2000 to 2001 |
0.6 |
1 |
|
| Poverty Rate, 2000 |
7.9 |
11.14 |
|
| % Public Aid Recipients 2000 |
3.3 |
3.79 |
|
| % Births to Unmarried Women in 2000 |
35.5 |
32.92 |
|
|
| Health |
IN |
USA |
|
| Health Care Cost Relative to U.S. average, 2002 |
1 |
0.99 |
|
| Infant Mortality /1000 Live Births, 1998 |
7.8 |
7.14 |
|
| Nonfederal Physicians, 1999 |
224 |
266.54 |
|
| Death Rate by Accident, 1998 |
2139 |
1988.92 |
|
| Estimated Rate of New Cancer Cases, 2001 |
506.6 |
479.19 |
|
| Obesity - % of Indiv. 30lbs over Weight or Greater (2001) |
24 |
20.46 |
|
|
Finances and Taxes
|
IN
|
|
USA
|
|
|
| Purchase Price of a building |
156611.01 |
175806.29 |
|
| Car Insurance |
1372.2 |
1698.53 |
|
| Corporate Income Tax % |
8.5 |
6.64 |
|
| Top Personal Income Tax |
3.4 |
5.2 |
|
| Sales Tax & Use Tax |
5 |
4.66 |
|
| Professional Services Tax |
N |
|
| Top Capital Gains Tax |
3.4 |
4.75 |
|
| Motor Fuel Tax, 02 |
0.233 |
0.23 |
|
| Real Estate: % of income per $100 |
|
| On Land & Buildings |
3.37 |
N/A |
|
| On Inventory |
Y |
|
| On Personal Property |
Y |
|
| State Tax Rate |
6.4 |
7.13 |
|
| Local Tax Rate |
0 |
7.13 |
|
| Unemployment Insurance Tax/ Per Employee |
2.7 |
2.36 |
|
| Internet Access Tax |
N |
|
|
| New Economy Index (1=Highest, 50=Lowest) |
IN |
|
|
|
|
| Overall State Ranking |
36th |
|
| Knowledge Jobs |
41st |
|
| Globalization |
22nd |
|
| Economic Dynamism |
30th |
|
| Digital Economy |
31st |
|
| Innovation Capacity |
36th |
|
| High Tech Jobs |
33rd |
|
| Venture Capital |
36th |
|
| Internet Access-1998 (%) |
51 |
|
| R & D Expenditures-1998 (Millions) |
3089.0000 |
|
| Number of New Patents (1998) |
1593 |
|
|
| Crime |
IN |
|
USA |
|
|
| Index Offences Total |
1293.08 |
3326.73 |
|
| Violent Crime Total |
111.69 |
385.32 |
|
| Murders |
2.14 |
3.95 |
|
| Forcible Rape |
8.9 |
28.03 |
|
| Assault |
66.05 |
261.06 |
|
| Property Crimes |
1181.39 |
2941.4 |
|
| Burglary |
260.42 |
678.55 |
|
| Larceny, Theft |
806.22 |
1942.89 |
|
| Motor Vehicle Thefts |
114.75 |
320.72 |
|
| Index Offences Rate |
2568.66 |
2735.58 |
|
| Murders Rate |
2.96 |
3.02 |
|
| Forcible Rape Rate |
14.63 |
25.16 |
|
| Robbery Rate |
38.39 |
52.25 |
|
| Aggravated Assault Rate |
108.37 |
195.86 |
|
| Property Crime Rate |
2404.29 |
2459.29 |
|
| Burglary Rate |
490.54 |
585.46 |
|
| Larceny, Thefts Rate |
1729.9 |
1660.47 |
|
| Motor Vehicle Thefts Rate |
183.87 |
213.85 |
|
|
Pollution
|
IN
|
|
USA
|
|
|
| Ozone in air (more Ozone = more Pollution) |
88.53 |
82.19 |
|
| Pollution Released, 1999 (Pounds) |
134272453 |
45901994.34 |
|
| Toxic Waste Received in State, 1999(Pounds) |
154088391 |
31524509.36 |
|
|
| From the 2000 Census Reports |
IN |
|
USA |
|
|
| Population |
3888413 |
203400320 |
|
| Average Family Size in 2000 |
3.05 |
3.1 |
|
| % of Eligible Voters Reported Registered, 2000 |
0.899 |
0.81 |
|
| Median age |
35.96 |
37.8 |
|
| Males per 100 Females |
92.2 |
94.67 |
|
| Percentage Unemployed |
5 |
5.97 |
|
| Use Public Transport |
0.39 |
1.12 |
|
| Travel Time |
24.21 |
24.55 |
|
| Median Value of a House |
74115.56 |
92201.9 |
|
| Monthly Owner Cost with Mortgage |
728.94 |
845.87 |
|
| Monthly Owner Cost without Mortgage |
248.12 |
283.44 |
|
| Contract Monthly Rent |
370.51 |
390.93 |
|
| Gross Rent |
457.34 |
463.96 |
|
| % of Household Total |
69.44 |
69.46 |
|
| % of Families Household Total |
54.67 |
54.65 |
|
| Avg Population per Household |
2.51 |
2.55 |
|
| Avg Population per Family |
3.02 |
3.06 |
|
| % of Non Families Household Total |
30.56 |
30.54 |
|
| Monthly Income-Household |
37890.36 |
38521.16 |
|
| Monthly Income Family |
44748.23 |
45249.75 |
|
| Per Capita Income |
17548.54 |
18724.65 |
|
| Earning per Male |
33974.86 |
33331.99 |
|
| Earning per Female |
22881.12 |
23722.78 |
|
| % Families Below Poverty Line |
7.12 |
9.88 |
|
| People speaking Less than fluent English |
1.37 |
3.53 |
|
| Persons Holding High School Certificate or More |
79.01 |
78.68 |
|
| Bachelor Degree Holders |
11.84 |
17.11 |
|
| Density |
1603.63 |
1175.8 |
|
| % of one Race |
7267.12 |
8737.95 |
|
| % of Black & Others |
923.08 |
1231.39 |
|
| % of American Indians |
20.49 |
70.5 |
|
| % of Asians |
86.5 |
393.43 |
|
| % of Hawaii |
2.9 |
13.87 |
|
| % of Others |
162.7 |
600.04 |
|
| % of Two or more Races |
111.27 |
245.37 |
|
| % of Hispanic or Latino |
346.85 |
1345.63 |
|
|
| Education |
IN |
|
USA |
|
|
| Verbal SAT Score, 2000 |
498 |
532.6 |
|
| Math SAT Score, 2000 |
501 |
536.06 |
|
| Public Elementary/Secondary Expenditures per pupil, 1999 (thousands) |
7207 |
6623.8 |
|
| % of Students Taking Exam, 2000 |
60 |
35.76 |
|
| % of Population Over 25 with HS Diploma, 2000 |
82 |
83.32 |
|
| % of Population Over 25 With Bachelor's Degree, 2000 |
20.3 |
24.62 |
|
| Pupil-Teacher Ratio in Public Elementary and Secondary Schools in 2000 |
16.6 |
15.52 |
|
| Average Teacher Salary, 1999 |
44195 |
41505.06 |
|
| Books in Public Library Per Capita, 1997 |
4.2 |
3.12 |
|
| College Degree - Graduating Institutions, 1997 |
96 |
82.12 |
|
|
| Quality of Life: Child Well - Being - 1998 |
IN |
|
USA |
|
|
| % Low Birth-Weight Babies |
7.9 |
7.51 |
|
| Infant Mortality Rates (deaths per 1,000 live births) |
7.8 |
7.14 |
|
| Child Death Rates (deaths per 100,000 children ages 1-14) |
26 |
24.84 |
|
Rate of Teen Deaths Rate by Accident, Homicide, and Suicide
(deaths per 100,000 teens ages 15-19) |
59 |
58.2 |
|
| Teen Birth Rate (births per 1,000 females ages 15-17) |
29 |
28.1 |
|
| % of Teens Who Are High School Dropouts (ages 16-19) |
6 |
9.16 |
|
| % of Teens Not Attending School and Not Working (ages 16-19) |
6 |
8.16 |
|
% of Children Living With Parents
Who Do Not Have Full-Time, Year- Round Employment |
22 |
24.02 |
|
| % of Children in Poverty (date reflect poverty in pervious year) |
15 |
17.29 |
|
| % of Families with Children Headed by Single Parent |
22 |
24.92 |
|
|
| Financial & Government Comparison |
|
IN |
USA |
|
| State Government Tax Revenue, 2000 |
10204197000.0000 |
11195307960 |
|
| Per Capita State Government Tax Revenue, 2000 |
1666.0000 |
1949.8 |
|
| State Government Debt Outstanding, 1999 |
7894464000.0000 |
10937316480 |
|
| Per Capita State Government Debt Outstanding, 1999 |
1296.0000 |
2259.96 |
|
| Gross State Product, 1998 (Millions) |
174433.0000 |
173820.7 |
|
| State Government Bond Rating (S&P, 1999) |
AA+ |
|
| Cost of Living Index , Selected Metro, Second Quarter, 2000 |
0.892 |
1.06 |
|
| Number of Bureaucrats per 100 Population, 2002 |
5.31 |
5.64 |
|
|
| Indiana Neighborhood |
|
| (large map with related neighborhood states) |
 |
|
| Song: On the banks of the Wabash |
|
|
Written by Paul Dresser
Composed by Paul Dresser
&apoRound my Indiana homesteads wave the cornfields,
In the distance loom the woodlands clear and cool.
Oftentimes my thoughts revert to scenes of childhood,
Where I first received my lessons, nature&apos school.
But one thing there is missing in the picture,
Without her face it seems so incomplete.
I long to see my mother in the doorway,
As she stood there years ago, her boy to greet.
[CHORUS]
Oh, the moonlight&apos fair tonight along the Wabash,
From the fields there comes the breath of newmown hay.
Through the sycamores the candle lights are gleaming,
On the banks of the Wabash, far away.
Many years have passed since I strolled by the river,
Arm in arm, with sweetheart Mary by my side,
It was there I tried to tell her that I loved her,
It was there I begged of her to be my bride.
Long years have passed since I strolled thro&apo there churchyard.
She&apos sleeping there, my angel, Mary dear,
I loved her, but she thought I didn&apot mean it,
Still I&apod give my future were she only here.
|
|
|
|
|
|
|
|