|
|
 | Popular Guides | |
 | Related Guides | |
|
|
|
|
State Profile >> Mississippi
|  Back Back |
|
|
| 35,854 Views |
NickName: The Magnolia State
Possible based on Chippewa Indian words "mici zibi," loosely meaning great river
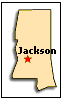
Capital City: Jackson
Location: 32.320N, 090.207W |
|
|
|
 |
| View USA Map |
|
| Brief overview |
|
|
Mississippi is the least costly state in the United states to live. It has a warm climate, and taxes are relatively low. Even the students fared better in the scores at SAT exam. Pollution levels are lower than the national average. But on the flip side, it is ranked among the bottom states in the following areas:
- Health: Mississippi is the 45th state that is preferable health wise.
- Livable: MO is also the 45th state that is preferred in the list of livable states (rankings by Morgan Quinto Press).
- Has just 46 colleges whereas the national average is 82.
For leisure and entertainment purposes, there are casinos to rival Las Vegas, world-acclaimed literary conferences, and a festival for nearly every day of the year are just a few of Mississippi's unexpected offerings. |
|
| 15 Vital Statistics Affecting Your Relocation |
MS |
|
USA |
|
|
| 1. |
Belief: "Most People are Honest" (6-level agree/disagree) |
3.52 |
4 |
|
| 2. |
Belief: "Most People Can be Trusted" |
0.17 |
0 |
|
| 3. |
Attended Meetings in Town or School Affairs (percent) |
0.13 |
0 |
|
| 4. |
Overall State Ranking - New Economy Index |
49th |
|
|
| 5. |
Cost of Living Index |
58.09 |
100 |
|
| 6. |
Average Apartment Rent |
691.0000 |
617 |
|
| 7. |
Average Home Price |
223447.0000 |
223400 |
|
| 8. |
Average Total Energy Cost |
113.4400 |
126.75 |
|
| 9. |
Average Phone Bill |
29.4300 |
16.85 |
|
| 10. |
Gasoline/Gallon |
1.4100 |
1.5 |
|
| 11. |
Hospital Room/Day |
324.8000 |
334.33 |
|
| 12. |
Doctor Visit |
61.3000 |
66.7 |
|
| 13. |
Average Auto Insurance Premium, 2000 |
784.37 |
792.91 |
|
| 14. |
% of Days That are Sunny |
59 |
56.88 |
|
| 15. |
Crime Index |
350.1 |
416 |
|
|
| Contents |
|
| Mississippi Info for you |
(All Links open in a separate window) 
|
|
| Area |
48434 sq.mi, 32nd Land 46914 sq. mi., 31st Water 1520 sq.mi., 25th Coastline 53 mi., 18th Shoreline 359 mi., 22nd |
|
| Area Code |
228, 601, 662 |
|
| County Profile |
82 Counties |
|
| Motto |
Virtute et armis |
|
| Capital |
Jackson |
|
| Largest Cities |
Jackson
Gulfport
Biloxi
Hattiesburg
Greenville
Meridian
Tupelo
Southaven
Vicksburg
Pascagoula |
|
| Capitol Tour |
mdah.state.ms.us/new/visit/mississippi-state-capitol/ |
|
| State Official Website |
http://www.ms.gov/ |
|
| Governor |
Phil Bryant (R) |
|
| No. of State Legislators, 2003 |
174 |
|
| Senators and Representatives |
US House
US Senate
Mississippi: House Members
Mississippi: Senate Members
|
|
| Industry |
Apparel, furniture, lumber and wood products, food processing, electrical machinery, transportation equipment. |
|
| Agriculture |
Cotton, poultry, cattle, catfish, soybeans, dairy products, rice. |
|
| Tree |
Southern Magnolia |
|
| Geographic Center |
Leake, 9 miles westnorthwest of Carthage |
|
| Highest Point |
Woodall Mtn. |
|
| Lowest Point |
Gulf Coast; sea level, 3rd |
|
Fatalities Caused by Tornadoes:
1950 to 2001 |
404 |
|
|
| Average Temperatures |
MS |
|
USA |
|
|
| Winter |
57.48 |
42.79 |
|
| Spring |
74.18 |
64.36 |
|
| Summer |
89.88 |
83.95 |
|
| Fall |
76.04 |
65.89 |
|
| Precipitation(Rain Fall) |
61.63 |
39.41 |
|
| % of Days That are Sunny |
109 |
103.29 |
|
|
| More Mississippi |
| Titbits |
|
|
| Nickname including its origin |
The Magnolia State ,Possible based on Chippewa Indian words "mici zibi," loosely meaning great river |
|
| Symbols |
flower: flower or bloom of the magnolia or evergreen magnolia (1952)
wildflower: coreopsis (1991)
tree: magnolia (1938)
bird: mockingbird (1944)
song: “Go, Mississippi” (1962)
stone: petrified wood (1976)
fish: largemouth or black bass (1974)
insect: honeybee (1980)
shell: oyster shell (1974)
water mammal: bottlenosed dolphin or porpoise (1974)
fossil: prehistoric whale (1981)
land mammal: white-tailed deer (1974), red fox (1997)
waterfowl: wood duck (1974)
beverage: milk (1984)
butterfly: spicebush swallowtail (1991)
dance: square dance (1995)
|
|
| Song |
Go Mis-sis-sip-pi Click Here for Song Click Here for Song |
|
|
| Demographics |
MS |
|
USA |
|
|
| Median Age 2000 |
34.21 |
37.8 |
|
| % Change in Population 2000 to 2001 |
0.4 |
1 |
|
| Poverty Rate, 2000 |
16.8 |
11.14 |
|
| % Public Aid Recipients 2000 |
5.8 |
3.79 |
|
| % Births to Unmarried Women in 2000 |
46.3 |
32.92 |
|
|
| Health |
MS |
USA |
|
| Health Care Cost Relative to U.S. average, 2002 |
0.9 |
0.99 |
|
| Infant Mortality /1000 Live Births, 1998 |
10.7 |
7.14 |
|
| Nonfederal Physicians, 1999 |
185 |
266.54 |
|
| Death Rate by Accident, 1998 |
1653 |
1988.92 |
|
| Estimated Rate of New Cancer Cases, 2001 |
518.8 |
479.19 |
|
| Obesity - % of Indiv. 30lbs over Weight or Greater (2001) |
25.9 |
20.46 |
|
|
Finances and Taxes
|
MS
|
|
USA
|
|
|
| Purchase Price of a building |
117725.75 |
175806.29 |
|
| Car Insurance |
1853.54 |
1698.53 |
|
| Corporate Income Tax % |
5 |
6.64 |
|
| Top Personal Income Tax |
5 |
5.2 |
|
| Sales Tax & Use Tax |
7 |
4.66 |
|
| Professional Services Tax |
N |
|
| Top Capital Gains Tax |
0 |
4.75 |
|
| Motor Fuel Tax, 02 |
0.188 |
0.23 |
|
| Real Estate: % of income per $100 |
|
| On Land & Buildings |
2.45 |
N/A |
|
| On Inventory |
Y |
|
| On Personal Property |
Y |
|
| State Tax Rate |
7.1 |
7.13 |
|
| Local Tax Rate |
7.3 |
7.13 |
|
| Unemployment Insurance Tax/ Per Employee |
2.7 |
2.36 |
|
| Internet Access Tax |
N |
|
|
| New Economy Index (1=Highest, 50=Lowest) |
MS |
|
|
|
|
| Overall State Ranking |
49th |
|
| Knowledge Jobs |
44th |
|
| Globalization |
49th |
|
| Economic Dynamism |
23rd |
|
| Digital Economy |
50th |
|
| Innovation Capacity |
50th |
|
| High Tech Jobs |
47th |
|
| Venture Capital |
43rd |
|
| Internet Access-1998 (%) |
49.9 |
|
| R & D Expenditures-1998 (Millions) |
366.0000 |
|
| Number of New Patents (1998) |
226 |
|
|
| Crime |
MS |
|
USA |
|
|
| Index Offences Total |
1614.13 |
3326.73 |
|
| Violent Crime Total |
119.91 |
385.32 |
|
| Murders |
3.57 |
3.95 |
|
| Forcible Rape |
15.41 |
28.03 |
|
| Assault |
59.77 |
261.06 |
|
| Property Crimes |
1494.23 |
2941.4 |
|
| Burglary |
406.49 |
678.55 |
|
| Larceny, Theft |
957.61 |
1942.89 |
|
| Motor Vehicle Thefts |
130.12 |
320.72 |
|
| Index Offences Rate |
4134.81 |
2735.58 |
|
| Murders Rate |
7.67 |
3.02 |
|
| Forcible Rape Rate |
37.62 |
25.16 |
|
| Robbery Rate |
94.07 |
52.25 |
|
| Aggravated Assault Rate |
165.53 |
195.86 |
|
| Property Crime Rate |
3829.93 |
2459.29 |
|
| Burglary Rate |
988.19 |
585.46 |
|
| Larceny, Thefts Rate |
2575.05 |
1660.47 |
|
| Motor Vehicle Thefts Rate |
266.67 |
213.85 |
|
|
Pollution
|
MS
|
|
USA
|
|
|
| Ozone in air (more Ozone = more Pollution) |
80.86 |
82.19 |
|
| Pollution Released, 1999 (Pounds) |
64402242 |
45901994.34 |
|
| Toxic Waste Received in State, 1999(Pounds) |
15730529 |
31524509.36 |
|
|
| From the 2000 Census Reports |
MS |
|
USA |
|
|
| Population |
1459711 |
203400320 |
|
| Average Family Size in 2000 |
3.14 |
3.1 |
|
| % of Eligible Voters Reported Registered, 2000 |
0.849 |
0.81 |
|
| Median age |
34.21 |
37.8 |
|
| Males per 100 Females |
84.76 |
94.67 |
|
| Percentage Unemployed |
9.21 |
5.97 |
|
| Use Public Transport |
0.83 |
1.12 |
|
| Travel Time |
25.15 |
24.55 |
|
| Median Value of a House |
56024.21 |
92201.9 |
|
| Monthly Owner Cost with Mortgage |
624.94 |
845.87 |
|
| Monthly Owner Cost without Mortgage |
227.47 |
283.44 |
|
| Contract Monthly Rent |
271.17 |
390.93 |
|
| Gross Rent |
351.05 |
463.96 |
|
| % of Household Total |
70.17 |
69.46 |
|
| % of Families Household Total |
44.99 |
54.65 |
|
| Avg Population per Household |
2.61 |
2.55 |
|
| Avg Population per Family |
3.16 |
3.06 |
|
| % of Non Families Household Total |
29.83 |
30.54 |
|
| Monthly Income-Household |
27174.48 |
38521.16 |
|
| Monthly Income Family |
33200.93 |
45249.75 |
|
| Per Capita Income |
13999.05 |
18724.65 |
|
| Earning per Male |
28388.5 |
33331.99 |
|
| Earning per Female |
19993 |
23722.78 |
|
| % Families Below Poverty Line |
21.35 |
9.88 |
|
| People speaking Less than fluent English |
1.65 |
3.53 |
|
| Persons Holding High School Certificate or More |
67.94 |
78.68 |
|
| Bachelor Degree Holders |
14.47 |
17.11 |
|
| Density |
735.61 |
1175.8 |
|
| % of one Race |
4842.38 |
8737.95 |
|
| % of Black & Others |
2110.17 |
1231.39 |
|
| % of American Indians |
14.15 |
70.5 |
|
| % of Asians |
45.86 |
393.43 |
|
| % of Hawaii |
1.44 |
13.87 |
|
| % of Others |
28.75 |
600.04 |
|
| % of Two or more Races |
39.6 |
245.37 |
|
| % of Hispanic or Latino |
79.92 |
1345.63 |
|
|
| Education |
MS |
|
USA |
|
|
| Verbal SAT Score, 2000 |
562 |
532.6 |
|
| Math SAT Score, 2000 |
549 |
536.06 |
|
| Public Elementary/Secondary Expenditures per pupil, 1999 (thousands) |
4658 |
6623.8 |
|
| % of Students Taking Exam, 2000 |
4 |
35.76 |
|
| % of Population Over 25 with HS Diploma, 2000 |
74.6 |
83.32 |
|
| % of Population Over 25 With Bachelor's Degree, 2000 |
18.9 |
24.62 |
|
| Pupil-Teacher Ratio in Public Elementary and Secondary Schools in 2000 |
15 |
15.52 |
|
| Average Teacher Salary, 1999 |
32800 |
41505.06 |
|
| Books in Public Library Per Capita, 1997 |
2 |
3.12 |
|
| College Degree - Graduating Institutions, 1997 |
46 |
82.12 |
|
|
| Quality of Life: Child Well - Being - 1998 |
MS |
|
USA |
|
|
| % Low Birth-Weight Babies |
10.1 |
7.51 |
|
| Infant Mortality Rates (deaths per 1,000 live births) |
10.7 |
7.14 |
|
| Child Death Rates (deaths per 100,000 children ages 1-14) |
42 |
24.84 |
|
Rate of Teen Deaths Rate by Accident, Homicide, and Suicide
(deaths per 100,000 teens ages 15-19) |
75 |
58.2 |
|
| Teen Birth Rate (births per 1,000 females ages 15-17) |
47 |
28.1 |
|
| % of Teens Who Are High School Dropouts (ages 16-19) |
10 |
9.16 |
|
| % of Teens Not Attending School and Not Working (ages 16-19) |
12 |
8.16 |
|
% of Children Living With Parents
Who Do Not Have Full-Time, Year- Round Employment |
28 |
24.02 |
|
| % of Children in Poverty (date reflect poverty in pervious year) |
0.3 |
17.29 |
|
| % of Families with Children Headed by Single Parent |
0.3 |
24.92 |
|
|
| Financial & Government Comparison |
|
MS |
USA |
|
| State Government Tax Revenue, 2000 |
4749481000.0000 |
11195307960 |
|
| Per Capita State Government Tax Revenue, 2000 |
1661.0000 |
1949.8 |
|
| State Government Debt Outstanding, 1999 |
3222129000.0000 |
10937316480 |
|
| Per Capita State Government Debt Outstanding, 1999 |
1131.0000 |
2259.96 |
|
| Gross State Product, 1998 (Millions) |
62216.0000 |
173820.7 |
|
| State Government Bond Rating (S&P, 1999) |
AA |
|
| Cost of Living Index , Selected Metro, Second Quarter, 2000 |
0.939 |
1.06 |
|
| Number of Bureaucrats per 100 Population, 2002 |
6.75 |
5.64 |
|
|
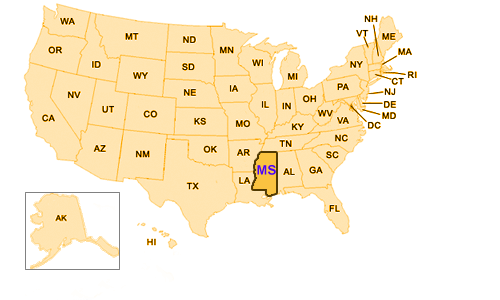
| Mississippi Neighborhood |
|
| (large map with related neighborhood states) |
 |
|
| Song: Go Mis-sis-sip-pi |
|
|
Words and Music by Houston
Davis
Verse:
States may sing their songs of praise
With waving flags and hip-hoo-rays,
Let cymbals crash and let bells ring
Cause here&apos one song I&apom proud to sing.
Choruses:
Go, Mississippi, keep rolling along,
Go, Mississippi, you cannot go wrong,
Go, Mississippi, we&apore singing your song,
M-I-S-S-I-S-S-I-P-P-I
Go, Mississippi, you&apore on the right track,
Go, Mississippi, and this is a fact,
Go, Mississippi, you&apoll never look back,
M-I-S-S-I-S-S-I-P-P-I
Go, Mississippi, straight down the line,
Go, Mississippi, ev&aporything&apos fine,
Go, MIssissippi, it&apos your state and mine,
M-I-S-S-I-S-S-I-P-P-I
Go, Mississippi, continue to roll,
Go, Mississippi, the top is the goal,
Go, Mississippi, you&apoll have and you&apoll hold,
M-I-S-S-I-S-S-I-P-P-I
Go, Mississippi, get up and go,
Go, Mississippi, let the world know,
That our Mississippi is leading the show,
M-I-S-S-I-S-S-I-P-P-I
|
|
|
|
|
|
|
|